London housing exhibition traces poverty and tenant activism across two centuries
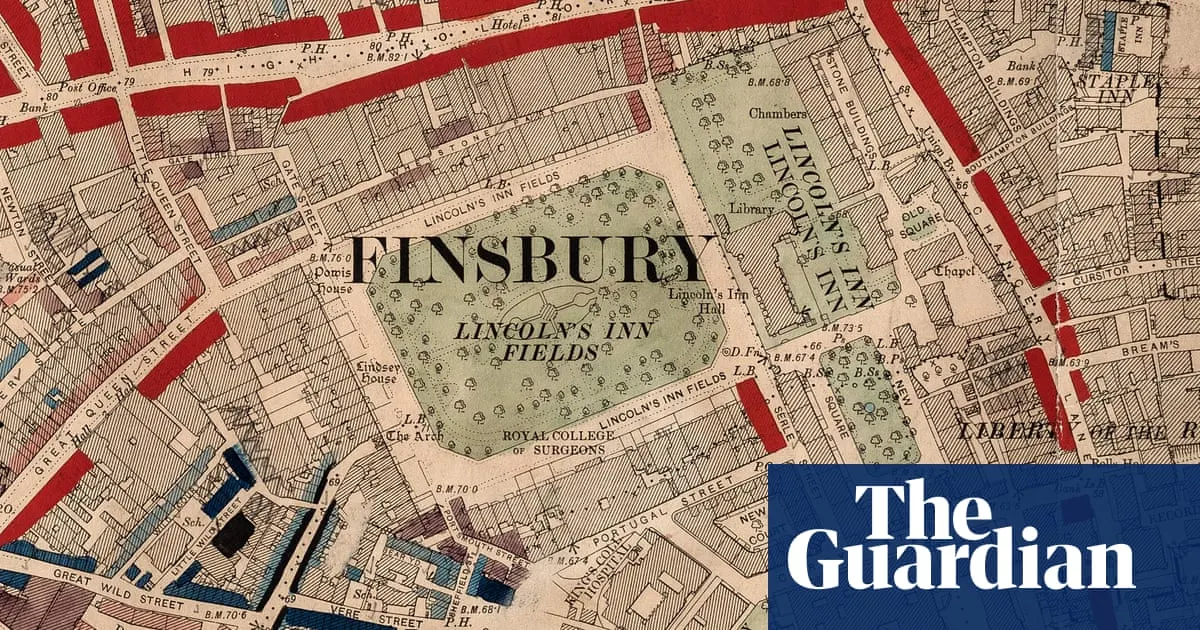
A new exhibition at Senate House library uses Charles Booth’s Victorian poverty maps to explore 200 years of London housing, from slum conditions and redevelopment to eviction and squatting. Comparing Booth’s maps with today’s deprivation indices shows that housing has generally improved, but poverty and wealth still sit side by side, while high rents and poor conditions remain concerns.
The exhibition includes Booth’s notes from interviews with working Londoners, pamphlets documenting tenant protests and rent strikes from 1936 to 1939, and a 1974 squatters’ handbook. Visitors can compare past and present conditions in their postcode, and hear interviews with people who have experienced homelessness. Curators say the history of collective action also offers a reminder that tenants can work together to make their concerns heard.
- Victorian maps show London’s stark housing inequalities.
- Poverty and wealth remain side by side in the capital.
- The exhibition traces tenant resistance through to today.
New here? Start with this
Charles Booth was a Victorian social researcher who mapped poverty across London in the late 19th century, using information gathered from residents and his own observations. His colour-coded maps showed how wealth and hardship could exist close together, and remain a reference point for studying the city.
Over the following two centuries, London’s housing changed through redevelopment, tenant campaigns, squatting and efforts to address poor conditions. Rent strikes in the 1930s and later tenant organising are part of that history, alongside the experiences of people who have faced homelessness.
Housing standards have generally improved, but high rents, poor conditions and uneven deprivation remain concerns. Looking at past maps and present-day measures helps show how these issues have changed, while the records of tenant activism offer context for how residents have responded.
Read the full article at the source →
Originally published by The Guardian as “Blue for poor, yellow for posh: the London maps exposing centuries of terrible housing”.