How the Iran war unfolded: every attack and oil price change – visualised
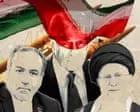
The article charts how US and Israeli strikes on Iran on 28 February 2026 escalated into a regional conflict with worldwide economic effects. The reported killing of Iran’s supreme leader, Ali Khamenei, and the effective closure of the Strait of Hormuz intensified the crisis, disrupting shipping and contributing to volatile oil prices.
The timeline follows six months of military attacks, threats, ceasefires and unsuccessful diplomatic efforts, with each apparent opening for de-escalation followed by renewed tensions. Hormuz is central because it normally carries about a quarter of global seaborne oil trade, with more than 100 vessels passing through daily; the analysis draws on conflict, shipping, oil-price and social-media data.
- Strikes on Iran rapidly widened into a regional war.
- Hormuz disruption drove global shipping and oil-market concerns.
- Ceasefires and talks repeatedly failed to end fighting.
New here? Start with this
The Strait of Hormuz is a narrow sea passage between Iran and Oman, linking the Gulf to the open ocean. It is a major route for oil tankers, so disruption there can affect energy supplies and prices around the world.
Iran’s supreme leader is the country’s highest political and religious authority, while the United States and Israel are major military powers involved in the conflict. The reported killing of Ali Khamenei and attacks involving Iran and its neighbours have raised the risk of a wider regional war.
The conflict has included military action, threats, ceasefires and attempts at diplomacy. Tracking these events alongside shipping and oil prices helps show how changes on the ground can affect trade and economies far beyond the region.