World news and discussion on TalkFuse.
UK house prices MAPPED as only two areas see prices fall — full list
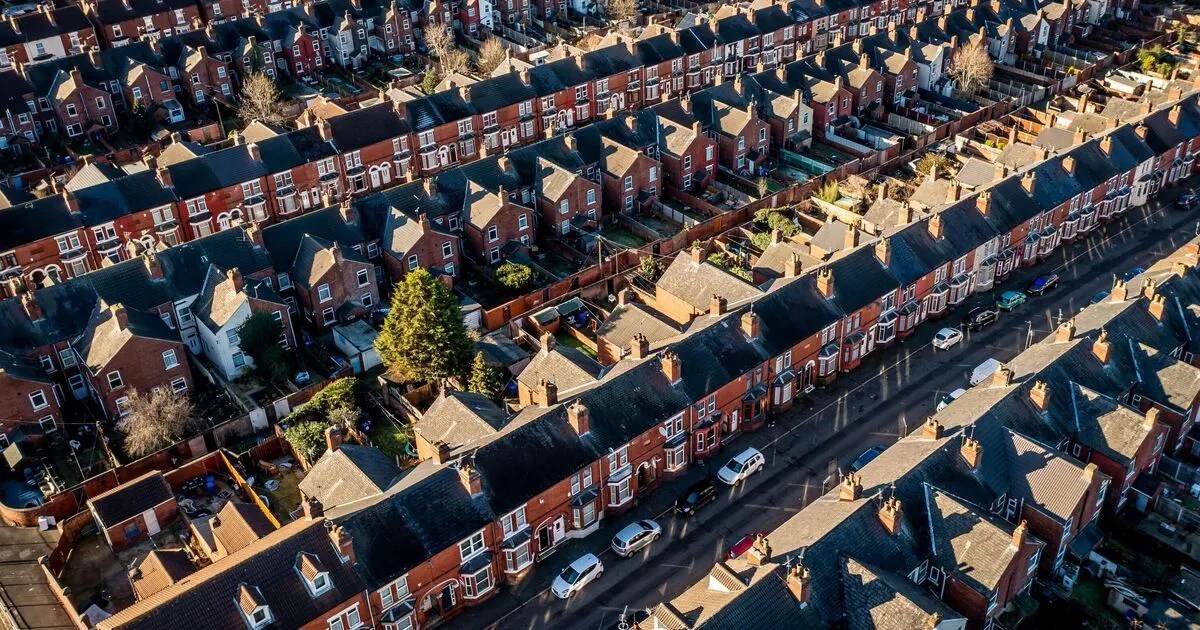
The average UK house price rose by 1.2% in the year to September, reaching £273,000, but prices fell in London and the South East. The figures show a sharp divide between regions, with Northern Ireland recording the strongest national rise and London facing affordability pressures.
England’s average price was £293,000, up 0.8%; Wales reached £215,000, Scotland £198,000, and Northern Ireland recorded the largest national increase, at 7.4%. London prices fell 3.5% to £546,000, while the South East edged down 0.2%. At council level, Westminster saw the steepest fall at 18.5%, while Armagh City, Banbridge and Craigavon rose 10.6%. UK rents averaged £1,411 a month in October, up 3.8% year on year.
In short
- UK homes averaged £273,000, up 1.2% year on year.
- London prices fell 3.5% to £546,000.
- Northern Ireland recorded the strongest national rise, at 7.4%.
Explained simply
House prices are commonly reported as national or regional averages, but those figures can hide large differences between towns and neighbourhoods. The UK includes four nations, and housing markets in places such as London and Northern Ireland can move in different directions.
Prices are shaped by factors including how many homes are available, demand from buyers, mortgage costs and what households can afford. London’s average is higher than the UK figure, so changes there can differ from those in areas where homes cost less.
Renting is another part of the housing market: rents show what tenants pay, while house prices affect people buying or selling homes. Both can influence where people can afford to live and the costs faced by households.